BRUKINSA patients can call the myBeOne Support™ program to talk to a dedicated nurse: 1-833-234-4363
THE SAFETY OF BRUKINSA
| Adverse Reactions1,2 | ARs in ≥10% of patients with WM (Cohort 1) | Pooled data: ARs in patients with hematologic malignancies | ||||
|---|---|---|---|---|---|---|
| BRUKINSA (n=101) | Ibrutinib (n=98) | BRUKINSA (N=1550)* | ||||
| All Grades (%) | Grades 3 or 4 (%) | All Grades (%) | Grades 3 or 4 (%) | All Grades (%) | Grade ≥3 (%) | |
| Upper respiratory tract infection | 44 | 0 | 40 | 2 | 39 | 2 |
| Pneumonia | 12 | 4 | 26 | 10 | 20 | 11 |
| Urinary tract infection | 11 | 0 | 13 | 2 | 13 | 2 |
| Diarrhea | 22 | 3 | 34 | 2 | 19 | 2 |
| Nausea | 18 | 0 | 13 | 1 | 11 | 0.2 |
| Constipation | 16 | 0 | 7 | 0 | 13 | 0.3 |
| Vomiting | 12 | 0 | 14 | 1 | 7 | 0.3 |
| Fatigue | 31 | 1 | 25 | 1 | 17 | 1 |
| Pyrexia | 16 | 4 | 13 | 2 | 10 | 0.8 |
| Edema peripheral | 12 | 0 | 20 | 0 | 4 | 0.2 |
| Bruising | 20 | 0 | 34 | 0 | 23 | 0.1 |
| Rash | 29 | 0 | 32 | 0 | 28 | 0.9 |
| Pruritus | 11 | 1 | 6 | 0 | 7 | 0.1 |
| Musculoskeletal pain | 45 | 9 | 39 | 1 | 30 | 2 |
| Muscle spasms | 10 | 0 | 28 | 1 | 5 | 0.1 |
| Headache | 18 | 1 | 14 | 1 | 11 | 0.4 |
| Dizziness | 13 | 1 | 12 | 0 | 11 | 0.3 |
| Cough | 16 | 0 | 18 | 0 | 19 | 0.1 |
| Dyspnea | 14 | 0 | 7 | 0 | 8 | 0.5 |
| Hemorrhage | 42 | 4 | 43 | 9 | 30 | 4 |
| Hypertension | 14 | 9 | 19 | 14 | 14 | 7 |
Safety in WM consistent with established BRUKINSA profile across B-cell malignancies1,2
The median follow-up time for Cohort 1 was 19.4 months.3
BRUKINSA had lower rates of:
Hypertension3
- Ibrutinib patients experienced nearly 2-fold higher incidence rate of hypertension on an exposure-adjusted basis (BRUKINSA vs ibrutinib: 0.7% vs 1.2%, respectively)
Major hemorrhage3
- Ibrutinib patients experienced nearly 2-fold higher incidence rate of major hemorrhage on an exposure-adjusted basis (BRUKINSA vs ibrutinib: 0.3% vs 0.6%, respectively)
*Chronic lymphocytic leukemia, Waldenström’s macroglobulinemia, mantle cell lymphoma, follicular lymphoma, marginal zone lymphoma, hairy cell leukemia, diffuse large B-cell lymphoma, and Richter’s transformation.3
WM=Waldenström’s macroglobulinemia.
Select laboratory abnormalities† (≥20%) that worsened from baseline in Cohort 1
| Laboratory Abnormality1 | BRUKINSA‡ | Ibrutinib‡ | ||
|---|---|---|---|---|
| All Grades (%) | Grades 3 or 4 (%) | All Grades (%) | Grades 3 or 4 (%) | |
| Hematologic abnormalities | ||||
| Neutrophils decreased | 50 | 24 | 34 | 9 |
| Platelets decreased | 35 | 8 | 39 | 5 |
| Hemoglobin decreased | 20 | 7 | 20 | 7 |
| Chemistry abnormalities | ||||
| Bilirubin increased | 12 | 1.0 | 33 | 1.0 |
| Calcium decreased | 27 | 2.0 | 26 | 0 |
| Creatinine increased | 31 | 1.0 | 21 | 1.0 |
| Glucose increased§ | 45 | 2.3 | 33 | 2.3 |
| Potassium increased | 24 | 2.0 | 12 | 0 |
| Urate increased | 16 | 3.2 | 34 | 6 |
| Phosphate decreased | 20 | 3.1 | 18 | 0 |
BRUKINSA had a higher rate of neutropenia (BRUKINSA=29.7% vs ibrutinib=13.3%), not associated with increased infection (BRUKINSA=66.3% vs ibrutinib=67.3%)3
†Based on laboratory measurements.
‡The denominator used to calculate the rate varied from 86 to 101 based on the number of patients with a baseline value and at least 1 post-treatment value.
§Patients on study were not required to fast for lab tests.
| Adverse Event3 | All Grades n (%) | Grade ≥3 n (%) | ||
|---|---|---|---|---|
| BRUKINSA (n=101) | Ibrutinib (n=98) | BRUKINSA (n=101) | Ibrutinib (n=98) | |
| Atrial fibrillation/ flutter | 2 (2) | 15 (15) | 0 (0) | 4 (4) |
BRUKINSA HAD LOWER RATES OF:
Atrial fibrillation/flutter2,3
- Ibrutinib patients experienced nearly 10-fold higher incidence of atrial fibrillation/flutter on an exposure-adjusted basis (BRUKINSA vs ibrutinib: 0.1% vs 1.0%, respectively)
- No incidences of Grade ≥3 atrial fibrillation or flutter in patients who received BRUKINSA
Initial analysis (19 months)3
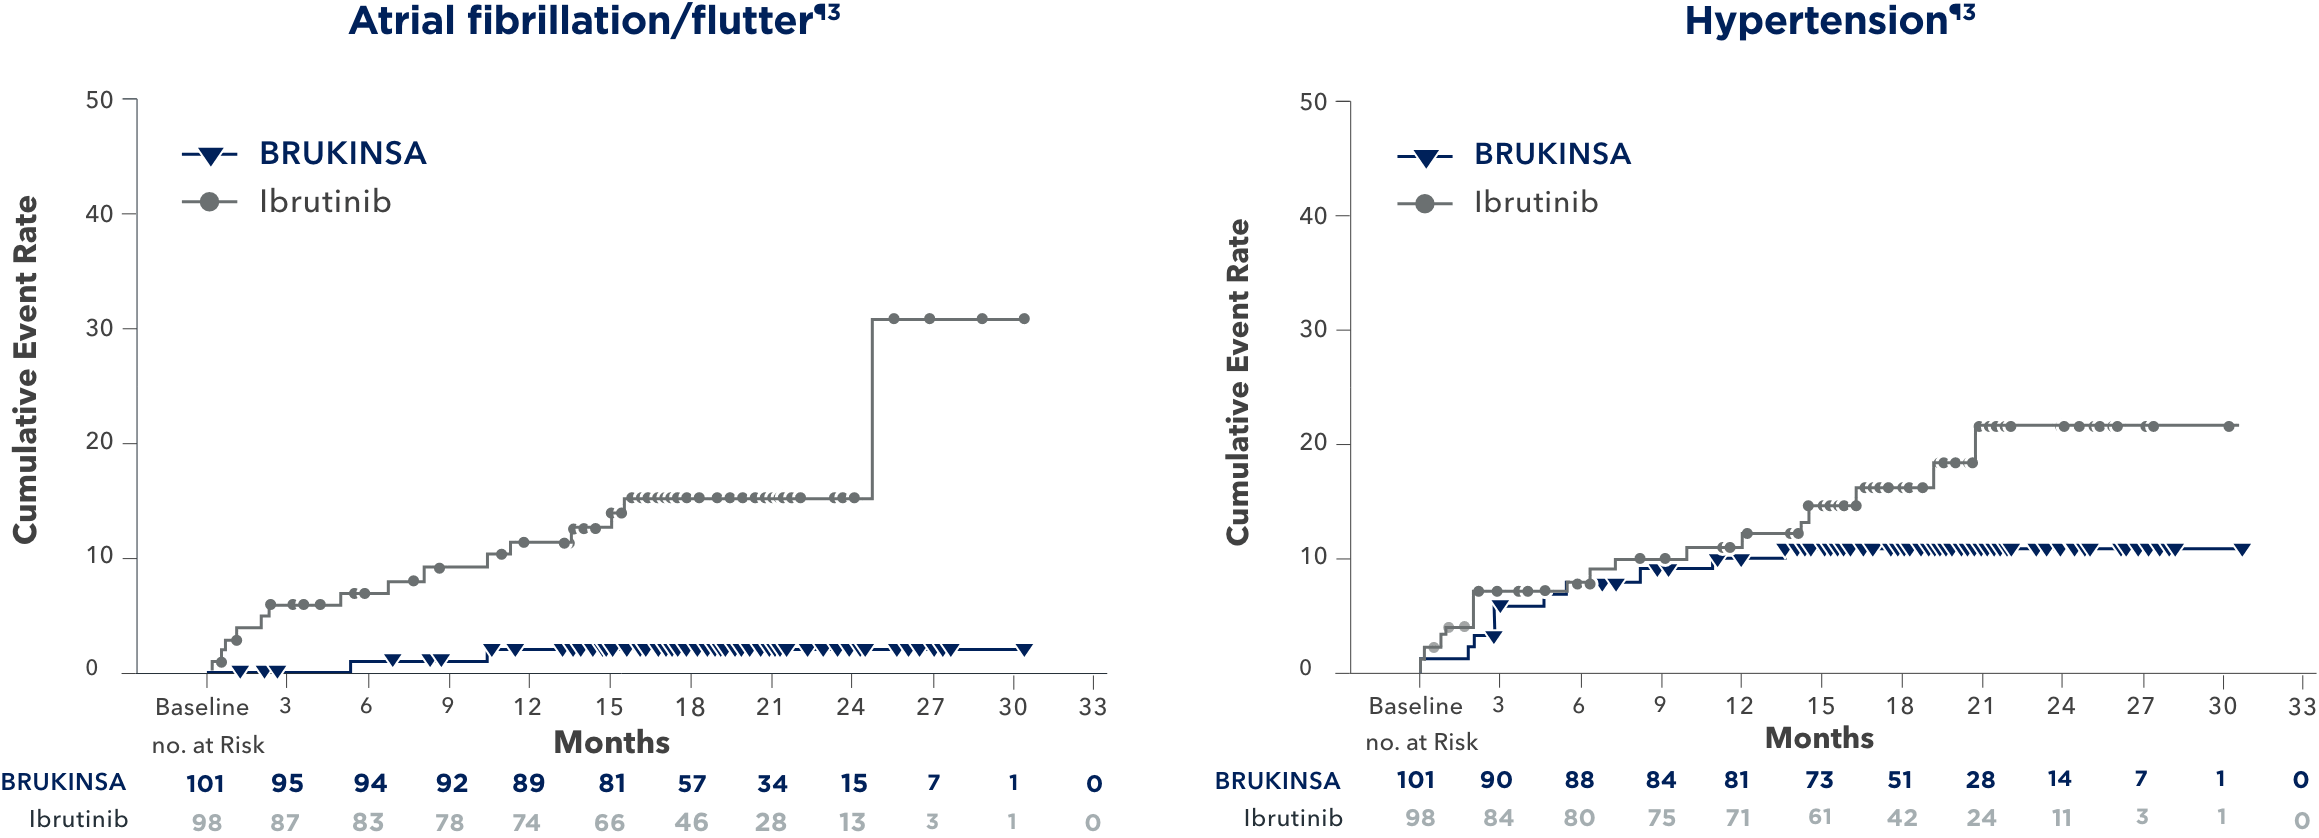
Adverse event trends
Incidence of atrial fibrillation/flutter and hypertension were lower in patients receiving BRUKINSA than in patients taking ibrutinib.4
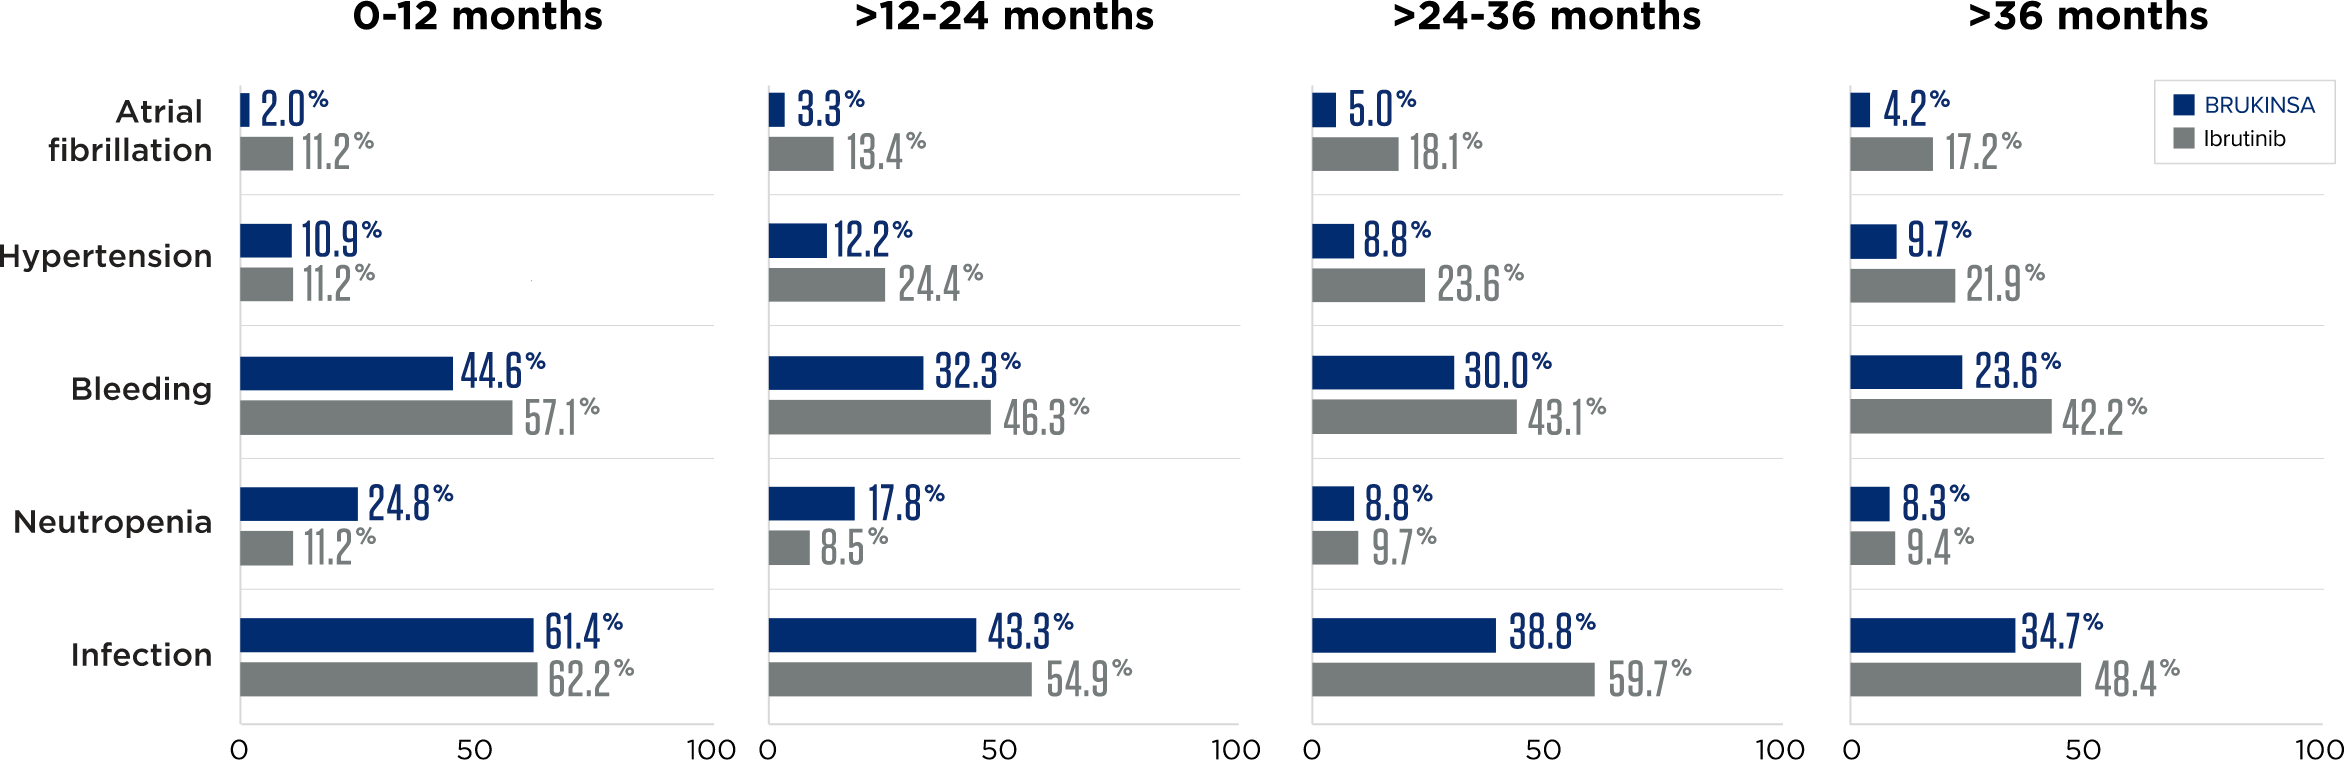
In a ~4-year follow-up consistent with the primary analysis, BRUKINSA continued to demonstrate lower rates of atrial fibrillation/flutter and hypertension4
¶The median follow-up time was 19.4 months for Cohort 1.
Long-term analysis (44 months)4
Initial analysis (19 months)3
Dose reductions due to AEs
BRUKINSA
Cohort 1 (n=101)
14
of patients
Ibrutinib
(n=98)
23
of patients
Discontinuation rate due to AEs
BRUKINSA
Cohort 1 (n=101)
4
of patients
Ibrutinib
(n=98)
9
of patients
Median duration of treatment: 25 months2
In a ~4-year follow-up consistent with the primary analysis, fewer AEs leading to treatment discontinuation and dose reductions occurred with BRUKINSA4
Dr Anthony Nguyen discusses the safety profile of BRUKINSA vs ibrutinib in WM
DISCOVER MORE VIDEOSIMPORTANT SAFETY INFORMATION
What should I tell my healthcare provider before taking BRUKINSA?
Before taking BRUKINSA, tell your healthcare provider about all of your medical conditions, including if you:
- have bleeding problems.
- have had recent surgery or plan to have surgery. Your healthcare provider may stop BRUKINSA for any planned medical, surgical, or dental procedure.
- have an infection.
- have or had heart rhythm problems.
- have high blood pressure.
- have liver problems, including a history of hepatitis B virus (HBV) infection.
- are pregnant or plan to become pregnant. BRUKINSA can harm your unborn baby. If you are able to become pregnant, your healthcare provider may do a pregnancy test before starting treatment with BRUKINSA.
- Females should avoid getting pregnant during treatment and for 1 week after the last dose of BRUKINSA. You should use effective birth control (contraception) during treatment and for 1 week after the last dose of BRUKINSA.
- Males should avoid getting female partners pregnant during treatment and for 1 week after the last dose of BRUKINSA. You should use effective birth control (contraception) during treatment and for 1 week after the last dose of BRUKINSA.
- are breastfeeding or plan to breastfeed. It is not known if BRUKINSA passes into your breast milk. Do not breastfeed during treatment with BRUKINSA and for 2 weeks after the last dose of BRUKINSA.
Tell your healthcare provider about all the medicines you take, including prescription and over-the-counter medicines, vitamins, and herbal supplements. Taking BRUKINSA with certain other medications may affect how BRUKINSA works and can cause side effects.
What are the possible side effects of BRUKINSA?
BRUKINSA may cause serious side effects, including:
- Bleeding problems (hemorrhage). Bleeding problems are common with BRUKINSA, and can be serious and may lead to death. Your risk of bleeding may increase if you are also taking a blood thinner medicine. Tell your healthcare provider if you have any signs or symptoms of bleeding, including:
- blood in your stools or black stools (looks like tar)
- pink or brown urine
- unexpected bleeding, or bleeding that is severe or you cannot control
- vomit blood or vomit that looks like coffee grounds
- cough up blood or blood clots
- increased bruising
- dizziness
- weakness
- confusion
- change in speech
- headache that lasts a long time
- Infections that can be serious and may lead to death. Tell your healthcare provider right away if you have fever, chills, or flu-like symptoms.
- Decrease in blood cell counts (white blood cells, platelets, and red blood cells). Your healthcare provider should do blood tests during treatment with BRUKINSA to check your blood counts.
- Second primary cancers. New cancers have happened in people during treatment with BRUKINSA, including cancers of the skin or other organs. Your healthcare provider will check you for other cancers during treatment with BRUKINSA. Use sun protection when you are outside in sunlight.
- Heart rhythm problems (atrial fibrillation, atrial flutter, and ventricular arrhythmias) that can be serious and may lead to death. Tell your healthcare provider if you have any of the following signs or symptoms:
- your heartbeat is fast or irregular
- feel lightheaded or dizzy
- pass out (faint)
- shortness of breath
- chest discomfort
- Liver problems. Liver problems, which may be severe or life-threatening, or lead to death, can happen in people treated with BRUKINSA. Your healthcare provider will do blood tests to check your liver before and during treatment with BRUKINSA. Tell your healthcare provider or get medical help right away if you have any signs of liver problems, including stomach pain or discomfort, dark-colored urine, or yellow skin and eyes.
The most common side effects of BRUKINSA include:
- decreased white blood cell count
- decreased platelet count
- upper respiratory tract infection
- bleeding
- muscle, bone, or joint pain
These are not all the possible side effects of BRUKINSA. Call your doctor for medical advice about side effects. You may report side effects to FDA at 1-800-FDA-1088.
What is BRUKINSA?
BRUKINSA is a prescription medicine used to treat adults with:
- Chronic lymphocytic leukemia (CLL) or small lymphocytic lymphoma (SLL).
- Waldenström’s macroglobulinemia (WM).
- Mantle cell lymphoma (MCL) who have received at least one prior treatment for their cancer.
- Marginal zone lymphoma (MZL) when the disease has come back or did not respond to treatment and who have received at least one certain type of treatment.
- Follicular lymphoma (FL), in combination with the medicine obinutuzumab, when the disease has come back or did not respond to treatment and who have received at least two prior treatments.
It is not known if BRUKINSA is safe and effective in children.
Please see full Prescribing Information including Patient Information.